MA.inVisionApplication overview
Doc. no.MIV-AP-300
Edition10/2026

Applications

From standard mechanical tests (tensile, compression, bending) to microscopic analysis and fracture/crack mechanics: the results you get from each test type and the standard testing methodologies applied in the evaluation.

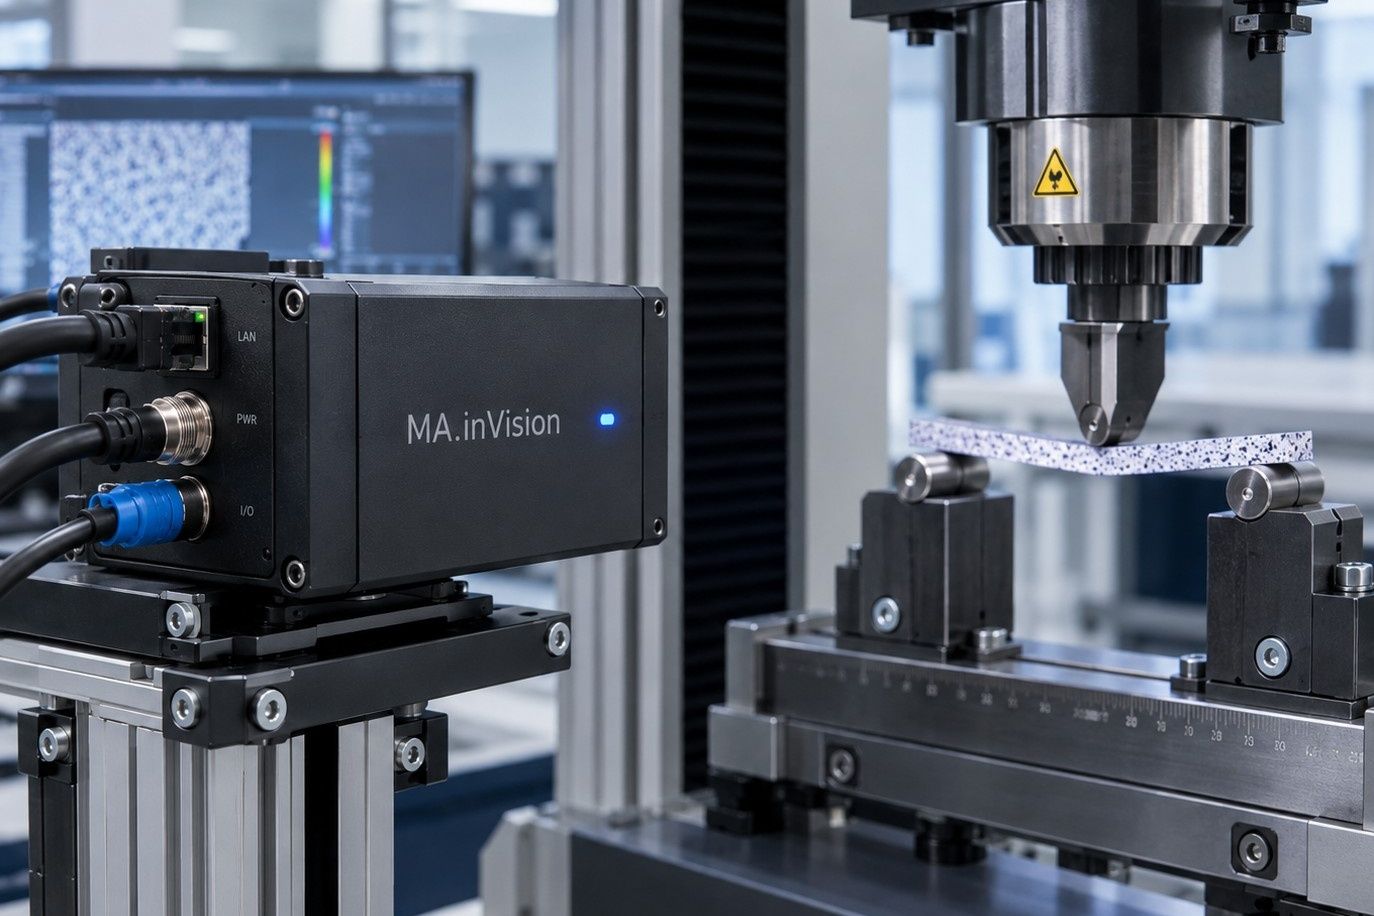
Rendering of the MA.inVision HS camera unit beside a three-point bending fixture, with a speckle-patterned specimen under the loading nose; the analysis software runs on a monitor in the background.

Tensile test

Full-field strain on the gauge length up to fracture: the virtual extensometer gives the engineering strain, the field shows where the specimen necks.

What you get

  • Engineering and true stress–strain
  • E, Rp0.2, Rm, strain at Rm
  • Poisson’s ratio (method of ASTM E132)
  • Strain along the gauge length, necking zone

Methods followed

ISO 6892-1 · ASTM E8/E8M · ISO 527-2 · ASTM D638 · ASTM D3039
Compression test

Strain fields on the specimen face under compression, with the stress–strain curve from the machine force.

What you get

  • Stress–strain under compression
  • Local yielding and barrelling on the strain map
  • Modulus and yield from the measured strain

Methods followed

ASTM E9 · ISO 604 · ASTM D695 · ASTM D6641

Bending test

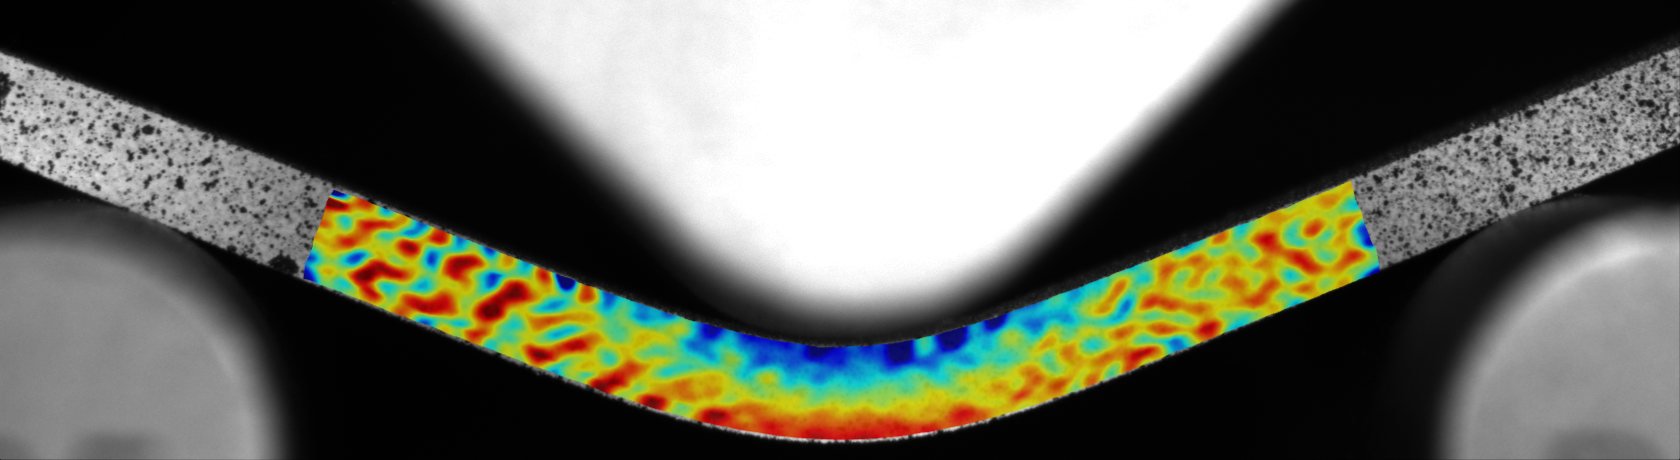
Three- and four-point bending: the strain through the thickness under the loading nose, and the nominal flexural values from force and deflection.

What you get

  • Flexural stress, strain and modulus
  • Strain through the thickness and the neutral axis
  • Strain map on the beam over the whole test

Methods followed

ASTM D790 · ISO 178 · ISO 14125 · ASTM D7264 · ASTM D6272

Small specimens

Mini tensile stages under a digital microscope with MA.inVision Micro: strain fields at the scale of the microstructure.

What you get

  • Micro-scale strain maps
  • Line profiles and region statistics
  • Force and displacement of the stage matched to the frames

Cracks and fracture

Crack zones are found and masked on the strain map; the crack opening is confirmed in the image, and the crack tip can be tracked.

What you get

  • Crack opening displacement
  • Crack-tip tracking, strain energy density
  • Apparent stress intensity factor, J-integral, R-curve

Three-point bending, tested

A high-alloy steel beam, tracked at 7,025 points 4 px apart. Move the gauge across the beam to read the strain from the top row to the bottom one; the switches show the tracked dots and the grid between them.

Strain map of a steel beam in three-point bending on the camera image, with the strain through the thickness and the flexural stress–strain curve

Move over the beam to place the gauge.

Through the thickness

εxx (%)Depth (mm)

Flexural stress–strain

Flexural strain (%)Flexural stress, nominal (MPa)
Frame
–
Deflection
–
Force
–
Flexural stress (nominal)
–
Flexural strain (nominal)
–
Top row
–
Bottom row
–
Neutral axis
–
Measured: Axial strain (εxx) distribution over ±11 mm of the beam, centred on mid-span under the loading nose, in a three-point bending test. (High-alloy steel, 5 × 2 mm cross-section, 32 mm span, 2 mm/min rate). 831 frames were analyzed, with 100 displayed using interpolation. Logarithmic strain fields were smoothed along the span (Gaussian, σ = 0.2 mm). The dots, 4 px (0.08 mm) apart, and the grid between them can be shown with the switches; towards the supports the arms rotate strongly, and the map shows more tracking noise there. Due to high localized contact pressure, top fiber compression exceeds bottom fiber tension, shifting the neutral axis below the mid-plane. Nominal bending stress and strain were calculated from machine force and deflection via ASTM D790 beam formulas, complete with toe compensation (nominal post-yielding, valid up to 5% strain). MA.inStrain output.

Configure it for your test

Please share your specimen specifications, test type, and testing speed with us. Our team will get back to you shortly with a tailored system configuration and a quotation.